If you’re looking to level up your crypto trading game, understanding how to read OKX candlestick charts is essential. Candlestick charts are one of the most powerful tools in technical analysis, and they can help you make informed trading decisions based on market trends and price action. Whether you’re a seasoned trader or just starting, this guide will walk you through everything you need to know about OKX candlestick charts and how to use them to improve your trading strategies.
Contents
ToggleWhat Are OKX Candlestick Charts?
OKX candlestick charts represent the price movements of cryptocurrencies over a specific time frame. Unlike simple line charts, candlestick charts provide more detailed information by displaying open, high, low, and close prices for each time period, allowing you to gain insights into the market’s sentiment and behavior.
Each candlestick on OKX candlestick charts consists of the following components:
- Open: The price at the beginning of the chosen time period.
- Close: The price at the end of the chosen time period.
- High: The highest price during that time period.
- Low: The lowest price during that time period.
The candlestick consists of a body and wicks (also known as shadows). The body represents the difference between the open and close prices, while the wicks show the highest and lowest prices reached during the time period.
OKX candlestick charts allow traders to assess market trends and identify potential reversals or continuation patterns. By understanding these charts, traders on OKX exchange can make better decisions and time their trades more effectively.
Why Are OKX Candlestick Charts Important for Crypto Traders?
Candlestick charts are an essential tool for every cryptocurrency trader, and the OKX candlestick chart is no exception. Here’s why these charts are so important:
Visual Representation of Price Action
The OKX candlestick chart gives traders a clear visual representation of the market’s price action. By looking at the size of the body and the length of the wicks, traders can quickly assess whether the market is bullish, bearish, or neutral. This makes it easier to identify trends and potential price movements in real time.
Spotting Market Trends and Reversals
One of the most significant advantages of OKX candlestick charts is their ability to help traders spot market trends and potential reversals. By studying candlestick patterns, traders can identify key signals that indicate whether the price will continue in its current direction or reverse. Common patterns like doji, engulfing, or hammer can provide powerful insights into market sentiment and future price action.
Support and Resistance Levels
Candlestick charts are also helpful in identifying support and resistance levels. These levels are crucial for determining entry and exit points for trades. With the help of OKX candlestick charts, traders can identify areas where the price is likely to reverse or experience significant resistance, helping them place stop-loss orders and set take-profit targets with greater accuracy.
Better Decision-Making
It allows traders to make more informed decisions based on real-time data. Instead of relying on guesswork or emotions, traders can use candlestick patterns to identify trends, momentum, and price actions that are likely to unfold. This helps them execute trades at optimal times, increasing their chances of success.
Key Components of OKX Candlestick Charts
Understanding the key components of OKX candlestick charts is essential to interpreting market movements accurately. Here’s a breakdown of the different parts of a candlestick:
Candlestick Body
The body of the candlestick represents the price range between the open and close prices. The color of the body indicates whether the market was bullish or bearish during the time period:
- A green or white body means the close price is higher than the open price (bullish trend).
- A red or black body means the close price is lower than the open price (bearish trend).
Candlestick Wicks (Shadows)
The wicks, also known as the shadows, represent the highest and lowest prices reached during the time period. The upper wick shows the highest price reached, while the lower wick indicates the lowest price reached. A long wick may indicate strong rejection at those price levels, which can provide important clues about market sentiment.
Candlestick Patterns
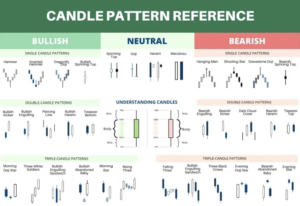
Certain candlestick patterns can indicate potential trend reversals or continuation patterns. For example:
- Doji: A candlestick with a very small body, indicating indecision in the market. It suggests that neither buyers nor sellers are in control, often leading to a trend reversal.
- Engulfing Pattern: This pattern occurs when a small candlestick is followed by a larger one that completely engulfs the previous candle. A bullish engulfing pattern suggests strong buying pressure, while a bearish engulfing pattern suggests selling pressure.
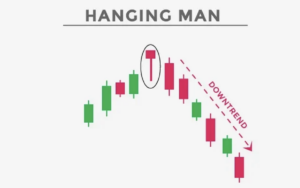
- Hammer: A candlestick with a small body and a long lower wick, often signaling a potential trend reversal, especially when found at the bottom of a downtrend.
By recognizing these patterns on the OKX candlestick chart, traders can predict price movements and make smarter trading decisions.
How to Read OKX Candlestick Charts
To effectively read OKX candlestick charts, it’s important to consider both individual candlesticks and candlestick patterns. Here’s a step-by-step guide on how to interpret OKX candlestick charts:
Identify the Trend
Start by identifying the overall trend of the market. Look for consecutive candlesticks that show consistent movement in one direction. If the market is moving upward, you’re likely in an uptrend, and if it’s moving downward, it’s a downtrend.
Look for Key Candlestick Patterns
Next, scan the chart for important candlestick patterns. Recognize key patterns such as doji, engulfing, hammer, or shooting star. These patterns provide strong signals about potential market reversals or continuation trends. For example, a doji might indicate indecision, while a bullish engulfing pattern could signal a possible price increase.
Analyze Candlestick Bodies and Wicks
Pay attention to the size and shape of the OKX candlestick body. A larger body typically signifies strong market momentum, while a smaller body indicates a lack of significant movement. Also, the length of the wicks can give you clues about price rejection at specific levels. If a candlestick has long upper wicks and short lower wicks, it could indicate that buyers tried to push the price up but failed to maintain control, suggesting a potential bearish reversal.
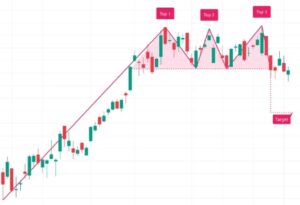
Determine Support and Resistance Levels
Use the OKX candlestick chart to identify key support and resistance levels. Look for areas where the price has previously bounced off (support) or struggled to rise above (resistance). These levels are crucial for placing stop-loss orders and setting profit-taking targets. Candlestick patterns near support or resistance levels can provide additional confirmation for your trades.
Watch for Confirmation
It’s always important to wait for confirmation before acting on a candlestick pattern. For example, if you see a bullish engulfing pattern, wait for the next candlestick to confirm that the price is moving upwards before entering a trade. Similarly, if you see a bearish reversal pattern, wait for confirmation before shorting the market.
Using OKX Candlestick Charts to Develop a Trading Strategy
Now that you understand how to read OKX candlestick charts, it’s time to use them to develop a winning trading strategy. Here are some tips for incorporating OKX candlestick charts into your trading plan:
Combine Candlestick Analysis with Other Indicators
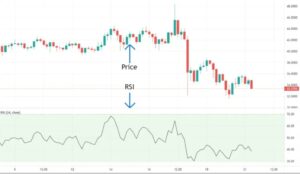
While candlestick charts are powerful tools, they work best when used in combination with other technical indicators. Consider pairing candlestick analysis with indicators like Moving Averages (MA), Relative Strength Index (RSI), or Bollinger Bands for more accurate predictions. This multi-indicator approach helps confirm trends and entry/exit signals.
Use Candlestick Patterns for Timing Entries and Exits
Candlestick patterns are excellent tools for timing your trades. For example, spotting a bullish engulfing pattern during an uptrend may provide a great entry signal. Similarly, recognizing a bearish reversal pattern at a key resistance level could give you a good exit signal. Remember, timing is crucial in trading, and OKX candlestick charts can help you enter and exit trades at the right moments.
Pay Attention to Timeframes
The timeframe you use for your OKX candlestick chart will significantly impact your trading decisions. Shorter timeframes (like 1-minute or 5-minute charts) can provide quick signals, but they may also be more volatile. Longer timeframes (like 4-hour or daily charts) can provide more reliable signals but may take longer to play out. Depending on your trading style, choose the timeframe that best suits your needs.
Conclusion
Mastering OKX candlestick charts is essential for any crypto trader looking to make informed, data-driven decisions. By understanding the key components of candlestick charts, learning to recognize key patterns, and combining your analysis with other technical indicators, you’ll be able to identify trends and opportunities with greater accuracy.
By incorporating OKX candlestick analysis into your routine, you’ll be equipped with the tools you need to enhance your understanding of the market and potentially improve your trading results. So, get familiar with them and start using them to boost your trading success today!
Đánh giá